Online Help Documentation
Summary By User Group
The Summary by User report shows the total time spent by user group(s) in applications and on websites. The report consists of a chart accompanied by a table. By default, the chart displays information about 15 most active user groups. When the mouse cursor is placed over a user group, the program shows a popup window with detailed information about this user group: active, idle and total time spent by a user group. The table lists all report user groups sorted by active time.
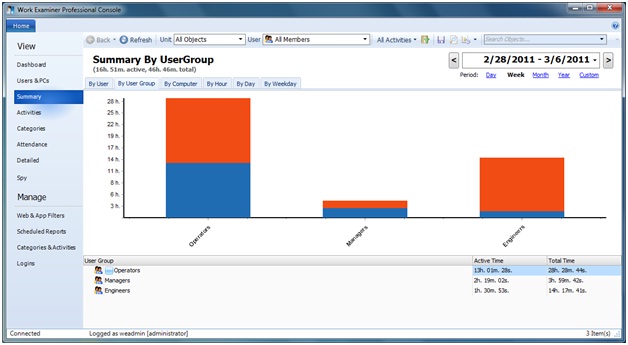
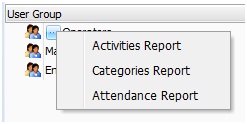
When a user group is clicked either on the chart or in the table (double click), the system will redirect you to the Activities report of a selected user group. When a user group-specific context menu is opened in the table, you can also view a Categories or an Attendance report.
The Summary By User Group report allows you to assess time distribution across user groups. It can help you quickly get a clear picture of the user groups workload of the whole company or a department. To view reports from different points of view, use additional filtering parameters described in the Report Controls section.
More information on managing user groups can be found in the User Groups section.
Start to monitor employees instantly!
Install our solutions all over your network within 5 minutes